Sunday, November 21, 2010

Vix: predicting capital flows and capital budgeting?

Came across this article by Ajay Shah for the Financial Express. Here's an excerpt.

Vix has, since, come down quite sharply. While this is still higher than the pre-crisis period, the halving of Vix is the best sign that the unprecedented fear of the what might come next has subsided. Low values of Vix do not mean that things are good. It means that we are no longer as uncertain, as compared with the dark days of October to December 2008. High values of Vix mean that while we observe a certain value of the S&P 500 index, this index is likely to bounce around a lot in the weeks to come.

This reduced uncertainty will make possible planning, investment, product launches, recruitment, etc. which is the foundation of the recovery.

Vix is directly important to India in two ways. First, it measures the uncertainty about the world economy, and lower uncertainty matters to the Indian economy, now that we are highly internationalised. The second channel of influence is from Vix to capital flows. High vix values are associated with low capital flows into India (and vice versa). The reduction in Vix is likely to yield improved capital flows into India.
I completely disagreed on this one!

Low vix points to increasing risk appetite, which may, or may not result in capital flows to emerging countries. With the election year uncertainty, it would not surprise me if capital flows to India stay subdued for the remainder of the year. Capital flows should be correlated with the growth prospects of the domestic firms.

Secondly, a low Vix might forecast lower volatility 30 days out(implied volatility basically predicts 30 day historical volatility), but it does not offer any clues for the remainder of the year in terms of direction or volatility. Indeed vix looks overextended on the downside and could bounce up on a short term basis (mean reversion). (I say this based on the divergence from it's 20 day or 10 day moving average).

Lastly, I don't think any firm carries out capital budgeting /forecasting decisions based on a low value of Vix!

Read the rest of this entry >>

Tuesday, September 15, 2009

Meredith Whitney CNBC interview.

Sorry for the extended hiatus. Always tough catching up after a long Labor Day vacation. Came across this excellent Meredith Whitney interview on CNBC. If she’s right on real estate, 2010 could be a tough year for the markets. Listen to this one very carefully!
Whitney : Home prices going down.


Read the rest of this entry >>

Friday, August 28, 2009

Friday edition: Role of inflation and interest rates in market valuation.

I’ve been thinking of doing or highlighting a thoughtful piece every Friday. So here’s a start!

Vitaliy Katsenelson recently came out with a postscript to his excellent book, Active Value Investing in Range-Bound / Sideways Markets.  I’ve read parts of it, and thoroughly enjoyed it. I admire Vitaliy as one of the few people who have the uncanny ability to think “outside the fog”. (You can check out his blog to know exactly what I mean.)

Vitaliy makes some great points and I particularly wanted to highlight this one regarding the role of interest rates and inflation in determining market valuations.


Let’s take a look at the role interest rates and inflation play in market cycles… My thoughts on the role of interest rates and inflation have changed since the book came out.

Let’s divide the interest/inflation chart into three zones: 1, 2, and 3. Zone 2 is the zone of peace. When interest rates and inflation are in this zone or thereabouts, they have little positive impact on P/Es. However, whenever inflation crosses into zone 3, investors become concerned about inflation, as they should. Inflation erodes real returns from stocks. Interest rate is a significant part of the discount rate investors use to discount future cash flows. A higher discount rate means companies are worth less, thus lower P/Es.

Zone 1 is a tricky zone. In that zone the Fed-model argument falls apart. When inflation falls below a certain level, let’s say 1%, investors become concerned that we’ll slip into deflation –a prolonged decrease in prices. Deflation brings very different risks to the table: it drives corporate revenues down while costs, which are often fixed, lag behind. Corporations start losing money; some go bankrupt. Also, unlike inflation, the Fed has few weapons to fight deflation; thus companies are for the most part on their own.

Though the discount rate used in discounted future cash flows benefits from low interest rates, the risk premium, an integral part of that equation, skyrockets. This to some degree explains why the Japanese market’s P/E collapsed while interest rates were declining. Low interest rates were a product of a very sick economy – not of strength.

Movements between these zones are very important, too. Movements towards stability(towards Zone 2 from Zones 1 and 3) are very positive for P/Es. Movements away from stability (Zone 2) are negative for P/Es.

Hmm..So are we still in a range bound market? When can we expect the next secular bull? He offers the following framework:


Good stuff!


I’ve uploaded the complete document for your perusal. (RSS/Email subscribers might have to come to the website to view the document)
Active_value_investing_range_bound_markets

Read the rest of this entry >>

Wednesday, August 26, 2009

Giant squids, black swans, and the financial sector.

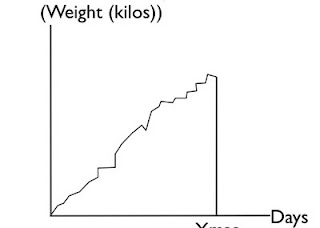
One of the most popular passages from the book Black Swan by Nassim Taleb has a chart illustrating the growth of a turkey. (I presume it’s popular because Taleb often talks about this). However, the image of a turkey has been much abused in relation to a Black Swan. Hence I’m going to replace the turkey instead with a giant squid reared in a fish farm.

Imagine you’re the squid. Each day, you get fed more than the last day, and your weight goes up, you feel healthier and happier, and life is good. Humans are the most wonderful creatures on this planet. Such a happy state exists right until harvesting, when the fat happy squid gets butchered. A chart of squid’s growth looks something like this:

Giant Squid

This event was entirely unpredictable to the squid right until the day it happened. This illustrates the concept of the black swan, the impact of the highly improbable.

Well I was browsing through a report called “Small lessons from a big crisis”, issued by the excellent folks from BIS.

An excerpt :

Imagine having placed a hedged bet back in 1900. A £100 long bet is placed on UK financial sector equities together with a £100 short bet on general UK equities. In effect, this is a gamble on the UK financial sector outperforming the market. How would that bet have performed over the intervening 110 or so years?

For around 85 years, this would have been a boring strategy, returning 2% per year. However, during the golden years of finance from 1986-2006, this would have risen to deliver an annual return of over 16%.

Well, the strategy’s staged a giant mean reversion since then, down almost 80% in 2008.


The similarity between the excess returns to finance and the Giant Squid are unmistakable. These were both black swan events waiting to happen.

Most of the excess gains in the financial sector were illusory in nature, an artifact of increasing leverage. The leverage juiced the sector’s equity returns, resulting in the spectacular growth shown above. Strip away the leverage, and the return on assets were miniscule.


Of course we might argue whether 2008 was a black swan, or was entirely predictable given how fragile the system had become because of the extreme leverage. (That’s a topic for another forum.)

Hopefully though, the era of excessive(and ever increasing) leverage is behind us and we are not giving birth to baby poults or squids right now for the next harvest or Christmas season.

Disclaimer: Any resemblances to real life turkeys or giant squids is entirey coincidental. No animals were harmed during the making of this article.

Read the rest of this entry >>