Friday, August 28, 2009

Friday edition: Role of inflation and interest rates in market valuation.

I’ve been thinking of doing or highlighting a thoughtful piece every Friday. So here’s a start!

Vitaliy Katsenelson recently came out with a postscript to his excellent book, Active Value Investing in Range-Bound / Sideways Markets.  I’ve read parts of it, and thoroughly enjoyed it. I admire Vitaliy as one of the few people who have the uncanny ability to think “outside the fog”. (You can check out his blog to know exactly what I mean.)

Vitaliy makes some great points and I particularly wanted to highlight this one regarding the role of interest rates and inflation in determining market valuations.


Let’s take a look at the role interest rates and inflation play in market cycles… My thoughts on the role of interest rates and inflation have changed since the book came out.

Let’s divide the interest/inflation chart into three zones: 1, 2, and 3. Zone 2 is the zone of peace. When interest rates and inflation are in this zone or thereabouts, they have little positive impact on P/Es. However, whenever inflation crosses into zone 3, investors become concerned about inflation, as they should. Inflation erodes real returns from stocks. Interest rate is a significant part of the discount rate investors use to discount future cash flows. A higher discount rate means companies are worth less, thus lower P/Es.

Zone 1 is a tricky zone. In that zone the Fed-model argument falls apart. When inflation falls below a certain level, let’s say 1%, investors become concerned that we’ll slip into deflation –a prolonged decrease in prices. Deflation brings very different risks to the table: it drives corporate revenues down while costs, which are often fixed, lag behind. Corporations start losing money; some go bankrupt. Also, unlike inflation, the Fed has few weapons to fight deflation; thus companies are for the most part on their own.

Though the discount rate used in discounted future cash flows benefits from low interest rates, the risk premium, an integral part of that equation, skyrockets. This to some degree explains why the Japanese market’s P/E collapsed while interest rates were declining. Low interest rates were a product of a very sick economy – not of strength.

Movements between these zones are very important, too. Movements towards stability(towards Zone 2 from Zones 1 and 3) are very positive for P/Es. Movements away from stability (Zone 2) are negative for P/Es.

Hmm..So are we still in a range bound market? When can we expect the next secular bull? He offers the following framework:


Good stuff!


I’ve uploaded the complete document for your perusal. (RSS/Email subscribers might have to come to the website to view the document)
Active_value_investing_range_bound_markets

Read the rest of this entry >>

Wednesday, August 26, 2009

Giant squids, black swans, and the financial sector.

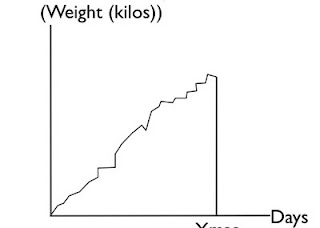
One of the most popular passages from the book Black Swan by Nassim Taleb has a chart illustrating the growth of a turkey. (I presume it’s popular because Taleb often talks about this). However, the image of a turkey has been much abused in relation to a Black Swan. Hence I’m going to replace the turkey instead with a giant squid reared in a fish farm.

Imagine you’re the squid. Each day, you get fed more than the last day, and your weight goes up, you feel healthier and happier, and life is good. Humans are the most wonderful creatures on this planet. Such a happy state exists right until harvesting, when the fat happy squid gets butchered. A chart of squid’s growth looks something like this:

Giant Squid

This event was entirely unpredictable to the squid right until the day it happened. This illustrates the concept of the black swan, the impact of the highly improbable.

Well I was browsing through a report called “Small lessons from a big crisis”, issued by the excellent folks from BIS.

An excerpt :

Imagine having placed a hedged bet back in 1900. A £100 long bet is placed on UK financial sector equities together with a £100 short bet on general UK equities. In effect, this is a gamble on the UK financial sector outperforming the market. How would that bet have performed over the intervening 110 or so years?

For around 85 years, this would have been a boring strategy, returning 2% per year. However, during the golden years of finance from 1986-2006, this would have risen to deliver an annual return of over 16%.

Well, the strategy’s staged a giant mean reversion since then, down almost 80% in 2008.


The similarity between the excess returns to finance and the Giant Squid are unmistakable. These were both black swan events waiting to happen.

Most of the excess gains in the financial sector were illusory in nature, an artifact of increasing leverage. The leverage juiced the sector’s equity returns, resulting in the spectacular growth shown above. Strip away the leverage, and the return on assets were miniscule.


Of course we might argue whether 2008 was a black swan, or was entirely predictable given how fragile the system had become because of the extreme leverage. (That’s a topic for another forum.)

Hopefully though, the era of excessive(and ever increasing) leverage is behind us and we are not giving birth to baby poults or squids right now for the next harvest or Christmas season.

Disclaimer: Any resemblances to real life turkeys or giant squids is entirey coincidental. No animals were harmed during the making of this article.

Read the rest of this entry >>

Tuesday, August 25, 2009

Bob Janjuah : Exit short positions if market crosses 1022 4 days in a row.

Note: Market here refers to S&P 500.

Came across this David Tice interview, courtesy Pragcap.

While the interview was standard David Tice fare, there was this quote from Bob Janjuah which caught my ears. (I’ve referred to his crash warnings earlier here. For an even better compendium, check out this FT Alphaville post.).

IF market closes above 1022 for 4 days in a row, it is time to hit the exits.
Note: Here "exit" refers to exiting from his short positions via stop loss. Basically, he's looking for a momentary spike to 1025-1050. If we can sustain above 1022 for 4 days, then it's time to exit short positions as another asset bubble is coming our way...
Hmm..I guess we’ll find out soon enough! (Tuesday was the second day the markets did exactly that).

Check out the interview below:


PS: As I type this, the Asian markets are selling off. If the sell off should extend to the US markets and S&P 500 closes below 1022, then this count shall be reset to zero..

Read the rest of this entry >>

Monday, August 24, 2009

Reading links 8/24/2009: The market direction edition.

It’s been a while since I posted on market predictions from the financial gurus. This might be a critical time, with a few commentators warning that markets could be topping out in August.

Well, this linkfest specifically focuses on market prognostications!

  • VALUE LINE HASN’T BEEN THIS BEARISH SINCE 2000 : Value Line reduced its recommended equity allocation to the range of 60% to 70%.This reflects a cautious to outright bearish posture on Value Line’s part, since the firm has never lowered its recommended allocation to below 50%. The last time it was lower than it is now was October 2000.?

    Value Line’s rationale for lowering its recommended equity allocation was not that the economic and financial news is about to take a big turn for the worse, however. Instead, the firm’s concern is that the stock market has rallied so far, so fast, that it has gotten too far ahead of itself.
  • Marc Faber: Expect a correction over the next 2 months.(CNBC)

  • Barry Ritholtz : I wouldn’t be surprised to see a 60-70-80 % rally before all this is over and the market rolls over and dies. This is a trading rally not a multi-year rally so it’s likely to end and retrace a part of it.

    Ritholtz has 1050-1080 as an upside target for the S&P 500, with a slight chance it can go as high as 1200 (It’s a low probability event). Making up 68% of loss is not unheard of. If the rally does extend to those outer limits, Ritholtz sees the Dow topping out "somewhere around 12,000.

  • Is this the start of the big one?

    I don't believe in market calls, and trying to time turns is a perilous game. But most savvy people I know have been skeptical of this rally, beyond the initial strong bounce off the bottom. It has not had the characteristics of a bull market. Volumes have been underwhelming, no new leadership group has emerged, and as greybeards like to point out, comparatively short, large amplitude rallies are a bear market speciality.

  • Top adviser turns bullish, for at most one quarter! (Well, I thought the headline was misleading, the advisor is actually BEARISH!)

  • Paul Tudor Jones on the bear market rally
    The bottom line is that we are not inclined to aggressively chase the market here. Rather, we eye a better opportunity to be long equities into year-end on a potential autumnal pullback.

  • Rounded Reversal into Exact Fibonacci Confluence on SPY

  • TOO FAR, TOO FAST? By Rob Arnott

    Now is not the time to be complacent. Most assets are no longer the bargains they were a few short months ago. As we have stated many times, tactical asset allocation is about taking risks when they are compensated and backing away when they are not. In some cases, the snapback has led risky asset classes like equities and high yield bonds to be susceptible to further price declines

  • Let’s play Ping Pong!

    The point here isn't so much to say, "Ah, prices are extreme and this is a top". Barring a market top, the extreme move from March, 2009 is indicative of two things: 1) the easy gains are behind us; and 2) the indices will likely move sideways to higher but in a more choppy fashion. If a market top comes out of this consolidation, it is likely to develop over the next several months. In general, market tops are affairs; market bottoms are events.

  • China Stocks Enter Bear Market as Index Falls 20% From High

  • More bearish data points for equities.

  • Manic Monday I'm sorry, the reality we see in the market does not justify options prices this high. Is there a reality in the market we don't see? Because if not, Fear is way too high, and anecdotally bullish.

  • Surprising sentimentHulbert :Sentiment picture has taken an unexpected turn for the better

  • Gummy Bears. Try not to overthink what the market might be saying. Cut in half from here? Unlikely.

Read the rest of this entry >>

Emerging markets: “new era” bubble talk is back.

In the final phases of a bubble’s blowoff, the talk of new paradigms and global tectonic shifts comes into vogue. One hallmark of the emerging markets mania back in 2007 was the bubble talk that went with it(See my post here). China and India seemed like failsafe can’t miss destinations.


Well, looks like some of it is back. Look at this article for instance. Here’s an interesting chart from the same.


Let’s consider the data from 2003 to 2008 (A very short span of 5.5 years):

Share of World GDP:
Chinese GDP went from 4.4% of global GDP to 7.3 %, or a rise of 66%.
Indian GDP went from 1.5% of global GDP to 2 %, or a rise of 33%.

Share of World market capitalization:
Chinese market capitalization as a share of world market capitalization went from 1.1% to 7.1% , an increase of ~545%!!!
India's share went up from 0.9% to 2.8%, a rise of 211%

The stock markets in India and China have gone up almost 8-9 TIMES their rise in the share of world GDP! The author completely side stepped this issue, as well as  the issue of valuations.

A similar argument can be made on the "new era" talk of China surpassing Japanese stock market capitalization. This fails to take into account the deep-value nature of the Japanese market right now. (A lot of Japanese companies trade below book value).

While a lot of effort has gone into bearish prognostications about China in Q4 of 2009, a similar case can be made for India as well. A year back, I had written about the bear case on India. With the failed monsoons, sagging rural demand, hike in taxes, and a lack of  reforms, I am currently extremely bearish, and a bear case part 2 can certainly be made right now.

One might be tempted to argue that these markets are fairly valued since their share of global market capitalization is now similar to their share in global GDP, but the reality is that emerging markets come with their own set of idiosyncratic risks: lack of transparent accounting, insider manipulation, lack of real shareholder ownership, and government interference, to name a few. I would argue that their share of global stock market capitalization should be well below their share of global GDP. This is an extremely important and contentious argument that needs to be revisited. (Note that people like Jeremy Grantham actually disagree on this one).

For now, suffice to say, bubble talk is back.

Read the rest of this entry >>

Saturday, August 22, 2009

CFA and the financial blogosphere.

Just wanted to share with my readers that I cleared my CFA Level 3 exam this week. It took me 18 months to clear all 3 levels… The blogosphere certainly made this look easy.

I’ve been an avid reader of the financial blogosphere for almost 5 years now, and a lot of credit goes to the insightful posts and ideas I’ve learned, assimilated, and hopefully mastered.

So a BIG BIG Thank You.

Here’s hoping I can pay back some of what I’ve learned these past few years.

Sincerely,

PS: Unfortunately, I cannot call myself a CFA yet as I do not have the requisite financial industry experience. Hopefully though that should be an easier hurdle to cross than the exams!

Read the rest of this entry >>

Thursday, August 20, 2009

A look at health care expenses and consumer spending.

Last week I posted a link to CNBC interviews by Tobias Levkovich. He alluded to the fact that over the last 30 years, all growth in consumer expenditure as a percentage of GDP had come from health care.

Well, came across this interesting post from Calculated Risk which discusses consumer spending as a percentage of GDP with and without health-care expenditures. It basically drives home the above point.


I’ll let the graph do the talking:


The inference is quite amazing. The consumers did NOT go on a spending binge as is widely believed. The actual increase was barely in line with GDP growth rates. The increase in consumer spending as a percentage of GDP was simply due to the rise in health care costs (!)

Ex-health, the ratio has stagnated. CR has these ominous lines:


But the more important point is what will happen in the future. From a demographic perspective, these are the best of times for healthcare expenses. The original baby busters (from 1925 to the early 1940s) are now at the peak medical expense years, but their medical care is being heavily supported by the baby boomers (now in their peak earning years).

Great point. The baby boomers could afford to support the expenses of the baby busters. Going forward, supporting baby boomers will be difficult. Health care expenses should thus face a secular downward pressure because of the changing demographics.

Read the rest of this entry >>

Tuesday, August 18, 2009

Reading Links 8/17/2009

A brief summary of what I've been reading this past week :

The Confidence Game by Kenneth Rogof : Asia may be willing to sponsor the west for now, but not in perpetuity. Eventually Asia will find alternatives in part by deepening its own debt markets. Within a few years, western governments will have to sharply raise taxes, inflate, partially default, or some combination of all three. As painful as it may seem, it would be far better to start bringing fundamentals in line now. Restoring confidence has been helpful and important. But ultimately we need a system of global financial regulation and governance that merits our faith. (Project Syndicate)

Doug Kass: A Summary of My Bearishness. (TheStreet.com)

RBS uber-bear issues fresh alert on global stock markets : Three-month slide could hit record lows, Royal Bank of Scotland chief credit strategist Bob Janjuah predicts. (Telegraph)

Slow Long-Term Growth, And Government's Response (Investor Insight): A chronic 1 percentage point annual rise in the consumer saving rate for the next decade or so will knock around 1 percentage point off real GDP growth after its effects work their way through the economy. That's a big contrast with 0.5 annual percentage point declines in the saving rate over the previous quarter century that added around 0.5 percentage points to growth. That total swing of 1.5 percentage points will reduce real GDP growth from 3.6% per year in the 1982-2000 salad days to 2.1%.

So with the five other inhibitors to growth in coming years -- financial deleveraging, weak commodity prices that will retard spending by producing countries, more government regulation and involvement in the economy, rising protectionism and deflation -- our forecast of 2.0% real GDP growth is probably even optimistic.

With 2% to 3% deflation, nominal GDP might not gain at all. And with slower growth in the years ahead, economic expansions are likely to be shorter and less robust while recessions will probably be deeper and more frequent.

All Eyes on Chinese Equities. (Investment Postcards)

Bob Prechter "Quite Sure" Next Wave Down Will Be Bigger and March Lows Will Break (Yahoo)


Roubini : A “jobless” and “wageless” recovery? (Forbes)

“For the labor market to stabilize, job losses need to slow to 100,000 to 150,000 per month, and jobless claims need to fall to around 400,000. Payrolls alone don’t reflect the strength of the household sector. Labor compensation and work hours also function as indicators, and both of these have slowed sharply in recent months. Even as borrowing conditions remain tight and home prices continue to fall, the dip in labor compensation will continue to constrain consumer spending, notwithstanding any fiscal stimulus.

“In a severe, consumer-led recession like this one, the labor market is a leading (rather than lagging) indicator of economic recovery, and the consumer still drives the US economy (private consumption still makes up over 70% of GDP). A slowdown in the pace of job losses from 650,000 to 250,000 is welcome, but in no way offers comfort about a prompt comeback of the US consumer. This raises concerns about the strength and sustainability of any economic recovery that most people are expecting in the second half of 2009, and beyond.”

A rally with troubling aspects (FT)

One troubling aspect of the rally is that, from a historical perspective, equity volatility remains elevated, with the CBOE’s Vix volatility index showing a reading of about 25. Before the credit squeeze in the summer of 2007, the Vix rarely rose to more than 20.

There is also concern that the strong run has largely reflected short sellers reversing bearish bets on stocks.

Low summer trading volumes are a cause for concern. Daily share volume on NYSE Euronext has not been above 2bn since June 25 and, in recent weeks, is behind April and May.

Between 1,100 and 1,150 [on the S&P] is where we think this rally will top itself out.”

For more, visit the news site, http://news.fundamentalinsights.slinkset.com/ .You can also follow me @fundinsights on Twitter for real time updates.

Read the rest of this entry >>

Friday, August 14, 2009

Interesting interviews with Tobias Levkovich.

As far as investment bank strategists go, I actually enjoy listening to Tobias Levkovich. I had written about him more than a year back here, where he argued for a W-shaped downturn, a collapse in commodity prices, emerging market declines, higher taxes and other interesting stuff.

Perfect for a hopefully slow Friday, here are some of his interviews on CNBC these past 2 months. I've posted my notes as well. Enjoy!

Interview 1.


Notes:

  • Production will climb in H2 and into 2010.
  • Increase in production rates drive earnings growth. Could provide bump to GDP data. Cost control merely provides operating leverage to the upside.
  • In last 30 years, all growth in consumer expenditure as a percentage of GDP has come from health care expenditures.
  • Our debts went up, but so did our wealth. When the debt went up by 6 trillion dollars, consumer assets went up by 24 trillion. They’re still up about 14 trillion.
  • Strength of Q2 earnings and probability of H2 earnings power supportive of further gains.
  • Possibility of a correction later in the year. Issues:
    -2010 earnings estimates are too high.
    -Some companies like mortgage insurers are in trouble, hitting the European banks.
  • Overshoot to 1100 on the S&P 500 possible.


Interview 2.


  • We’re still going somewhat higher. Still an environment where people doubt that stocks will be moving higher, and earnings will be going up.
  • The big discussion is this whole cost cutting, not revenues driving earnings thing.
  • We’re also at a stage where production has to tick up as we have been destocking at a severe rate. Inventories will not build up. Only destock at a more moderate level.
  • CEO confidence is a great inverse indicator.

  • Mutual funds and pension funds have performed better than hedge funds in this environment.


Click here for Interview 3.
  • This is a cyclical bull not a secular bull. Next secular bull will launch around 2012-2013. Secular bull markets have to break above the previous highs.

  • Production of cars in North America is 4 million units, with sales of 7 million units. Under producing very severely to reduce inventories. Car makers can increase production by 75% and not build a stitch of inventories.
  • Historically production rates drives earnings. Every cyclical recovery has started that way. Not generated by end market sales but by production increases.
  • Bullish but realizes that there will be setbacks along the way.
  • Labor costs are a major part of inflation, and with unemployment at 10% and global labor losses, unless we put in major protectionist measures, hard to see inflation.

Dated but still good fourth interview presented without comment.

Read the rest of this entry >>

Wednesday, August 12, 2009

Half of American mortgage holders to be underwater by 2011

Interesting report out from Karen Weaver, Deutsche Bank, arguing that the percentage of owners with negative equity would double by 2011. Most of the information should be familiar to the readers.

The next leg? The percentage of conforming borrowers with negative equity is expected to go up by more than 250%. Karen predicts 41% conforming borrowers to have negative equity in 2011 compared to 16% in the first quarter. The numbers for prime jumbo go to 46% from 29% currently.

Read more here, or watch the CNBC interview by clicking on the image below.


Just a note that CNBC incorrectly highlights that half of American homeowners would be underwater in 2011. Bubblevision for a change decides to be uber bearish! It’s not half of American homeowners, but half of American mortgage holders who would be underwater. This is of course all dependent on job losses. If job losses do not peak at 10% but keep heading up, this thing is going to get a lot worse. Which is why jobs are a leading indicator in this whole thing.


Negative equity. Underwater mortgages. Drowning homeowners. Maybe time for a few swimming lessons!


Source:

FT Alphaville
Deutsche Bank on those drowning US homeowners
http://ftalphaville.ft.com/blog/2009/08/06/65536/deutsche-bank-on-those-drowning-us-homeowners/

CNBC
Drowning in Debt
http://www.cnbc.com/id/15840232?video=1206971011&play=1

Read the rest of this entry >>

Monday, August 10, 2009

Festival of Stocks #153

Fundamental Insights is proud to host the 153rd edition of the Festival of Stocks. The Festival of Stocks is a blog carnival dedicated to highlighting bloggers’ best articles on stock market related topics. This will include research and commentary on specific stocks, industry analysis, ETFs, REITs, stock derivatives, and other related topics.

Before reviewing submissions from some of the best financial blogs on the web, I wanted to introduce new readers to Fundamental Insights. Here you’ll find investment and trading ideas discussed using fundamental and technical analysis. Please look around at our recent posts or the favorites section to get an idea. For fresher insights, stay updated via RSS feed, email or twitter.

Now, onto this week’s submissions.

Steve Alexander presents an interesting article on Goodwill Accounting and MFI, Part 1 - MagicDiligence. He writes: "Goodwill is an accounting concept used to track the purchase price of acquisitions. It is a fairly involved concept, and one that MFI largely ignores. This first of two articles describes Goodwill, how it is accounted for, and a simple example."

Michael Johnston presents Why Everything You’ve Heard About Leveraged ETFs Is Wrong at ETFdb. Good read.

Value Investing Pro discusses David Dreman's CNBC interview on August 05,2009.

Zach Scheidt presents Home Inns Vulnerable to China Lodging posted at ZachStocks. Ctrip.com Results pushed HMIN higher. The China lodging firm is vulnerable because of its high stock multiple and the potential letdown after the Shangai World's Fair.

Steve Patterson cautions against investing in Cisco Systems (CSCO).

Dividends4Life analyzes Becton Dickinson & Co. (BDX). Becton, Dickinson and Co provides a wide range of medical devices and diagnostic products used in hospitals, doctors' offices, research labs, and other settings.

Right Price Investing presents an Investment Manifesto 2.0. It's good!

The Viewspaper presents FIIs and the Indian Stock Market.

My Wealth Builder speculates on Expecting Another Bubble The basic premise? Low interest rates are bound to create another bubble. Hopefully, by expecting another asset bubble, you can protect your savings better than was done during the recent housing and financial crash.

Investing School presents a primer on What is Net Working Capital..

Forexoma presents a helpful primer on Money Management skills in Forex Trading Money management is the most important part of forex or for that matter any type of trading.

Darwin's Finance presents a primer on How Stock Options Work? .

Money Smart Life discusses Actively Managed Exchange Traded Funds.

Dividend Growth Investor presents a Dividend Stock Analysis on Supervalu (SVU).

Silicon Valley Blogger reviews Zecco posted at The Digerati Life.

The Smarter Wallet presents Trend Analysis For The US Dollar Index and Crude Oil Market.

The Canadian Finance Blog presents The Kondratieff Wave: Tracking The Past Or Predicting The Future? The Kondratieff Wave was created in 1926 but may be a sign of what will happen in today's economy.

Sun shares his trading experience with OptionsHouse posted at The Sun’s Financial Diary.

Stock Pursuits presents his 2009 Net-Net Stocks Performance.

Associate Money warns against using home equity loans to invest in the stock markets.

Money Ning points out that 401(k), Traditional IRA and Roth IRA have different tax implications..

Doug reviews Some Bank Stocks That Might Be Worth Watching.


That concludes this edition of the Festival of Stocks. Be sure to leave comments as you visit each of the blogs that participated in this week’s Festival of Stocks. They’ll appreciate knowing folks are reading their articles.

Submit your blog article to the next edition of festival of stocks using the carnival submission form. Past posts and future hosts can be found on the blog carnival index page.

Read the rest of this entry >>

Reading links 8/9/2009

With markets going higher week after week, looks like we’re back in Wonderland.. Even Roubini is bullish!

Here are the reading links for this week:

  • The sick fight over health care: (Great read) A too-cautious Obama has let the right define the debate -- and now meaningful reform hangs in the balance. (Salon)

  • Earnings: Worst Decline In History: While this is certainly makes for a great story that we can tell and retell to the grand kids (boring them to tears), it doesn’t really mean much. We are at an extraordinary moment in economic history. One where we are clinging to the ledge by our fingernails and peering down at the precipice below. In such unorthodox times, orthodox measures such as the price earnings ratio can fool, rather than inform you. (Trader's Narrative)

  • Melting up in the Summer heat : While a lot of attention is being focused on the S&P 500's move above 1,000, most chartists are probably focused on 1,005. As shown below, the S&P 500 failed twice to rally above this level back in October and November of last year. If the index manages to meaningfully break above 1,005, there is little in the way of resistance for the next 95 S&P 500 points. (Bespoke)

  • How to Fix the Health-Care ‘Wedge’ (WSJ)

  • The Running of the Sheep: Today we get word that equity fund inflows this week have been HUGE - the largest since August 2007, shortly after which the market peaked, followed by a sickening plunge. Now that the market has run up some 46% since the last Running (away) of the Sheep, the woolly stampede as reversed direction. Will the carnage be just as bad this time? History says yes... (InvestorWalk)

  • Tudor Investment Corp says it’s a bear market rally: Tudor essentially sees the market rallying then falling, and then repeating the cycle again. We are currently in the midst of a large rally which he feels will subside and give way to a decline in markets come September of this year. Tudor cites numerous negative catalysts for the move, including slowed growth in China. However, he still thinks that the markets will end the year then on a positive note and would be a buyer on large dips purely for the trade. This is because he thinks that 2010 could be another negative year for stocks as the rallying then declining cycle plays on. Being nimble is the name of the game and letting the tape lead you is the key here. (MarketFolly)

  • Credit Suisse - Market Now At Euphoric Levels. (Zero Hedge)

  • Mark Hulbert : Four indicators to watch for when rally may be over: The bottom line? Only one of these four indicators is even close to flashing a warning signal right now, which is why Davis is bullish right now. (Marketwatch)

  • The Elusive Correction Is Upon Us: As the bears continue to wonder when stocks will swoon again, investor sentiment data is starting to line up in their favor. (Barron's)

  • CHART OF THE DAY: Shades Of 1929 (Clusterstock)

  • Do Index Funds Contribute to Mispricing? (Dimensional Funds)

  • Banks Prepping to Bring More Assets Back Home to Balance Sheets. (WSJ)

  • Have We Reached a Top? (Minyanville)

  • What does a double dip recession look like? (Credit Writedowns)

  • Too many crooks.(PDF): Why Europe is attractive,and the problem with I-banks. (Price of Everything)

  • Brace for a decade of lower Chinese growth : Over the next five years or more Chinese economic growth is going to be constrained by growth in Chinese consumption. The massive but unsustainable investment in infrastructure and new production facilities that characterises the Chinese fiscal stimulus package will not be able to change this fact. From its dizzying heights during the past two decades, the world needs to prepare itself for a decade during which, if all goes well, China grows at a still respectable but much lower rate of 5-7 per cent. If the current fiscal stimulus package retards China’s adjustment process, as many analysts argue that it does, growth rates may be much lower. (FT)

  • The (confused) economics of cash for clunkers (Curious Capitalist)

  • Stock Market History Of High Momentum Thrusts : Bullish in the longer and intermediate term. (Trader's Narrative)

For more, please visit the news site,http://news.fundamentalinsights.slinkset.com/ .You can also visit @fundinsights on Twitter for real time updates.

Read the rest of this entry >>

Sunday, August 9, 2009

Fibonacci levels in the news : a contrarian take.

I had written about key Fibonacci levels in a post about a week ago. Turns out Fibonacci has really been in the news for retracement levels this week. While the absolute numbers might differ marginally, the upshot is the same. These levels are being watched by a huge number of investors. Consider the sample below:

  • This CNBC video uses Fibonacci retracement levels and points out the negative price divergence in the RSI level for the Shanghai index. The rally looks to be running out of steam. He also discusses the Shanghai index as a 'leading indicator' (something I've alluded to in the past).

  • Afraid to Trade has this post on S&P 500 resistance levels using Fibonacci.

  • David Sneddon from Credit Suisse points out the 1007-1014 retracement level on the S&P 500, and that the advance-decline line has flat lined.

  • This chart from the Big Picture blog has retracement targets similar to Fibonacci levels of 1014 on the S&P 500.

  • Zero Hedge shares this chart on the Fibonacci retracement levels.

  • Target and support levels for the Shanghai index in this CNBC video are similar to the levels posted using Fibonacci.
You can read my earlier analysis by clicking here.

The key point is that most commentators see the equity markets upside capped at around 0-10% from here, but the downside is considerable, quite possibly even retesting the March lows. Even the non-Fibonacci fundamentals driven consensus seems to be for at most a rally to around the 1,050-1,100 mark on the S&P 500. This suggests we’ll either:
a) go down around here, or
b) go right through 1100.

Consider the second case. If one were to look at all this Fibonacci analysis from a contrarian perspective, this might be bullish news. Just as the widely discussed head-and-shoulders pattern turned out to be a head fake and the equity markets rallied sharply, the current consensus on using Fibonacci retracements could be a bullish omen.

To paraphrase the Bespoke group, with so many market and economic indicators reaching pre-Lehman levels, one has to ask: Will the market be next? Reaching pre-Lehman levels would take us to 11,000 on the Dow and 1,200 on the S&P 500.

Read the rest of this entry >>

Wednesday, August 5, 2009

What's next for US banks?

From the article What Next US Banks :

Total credit losses on US-originated debt from mid-2007 through the end of 2010 will probably be in the range of $2.5 trillion to $3 trillion, given the severity of the current recession (Exhibit 2). Some $1 trillion of these losses has already been realized. Since US banks hold about half of US-originated debt, the US banking and securities industry will incur about $750 billion to $1 trillion of the remaining $1.5 trillion to $2 trillion of projected losses on this debt, which includes residential mortgages, commercial mortgages, credit card losses, and high yield/leveraged debt. These numbers are in the same range as those of the US government, which calculated a $600 billion high-end estimate of credit losses for the 19 largest institutions.


Since the middle of 2007, the US banking and securities industry has absorbed some $490 billion of losses, or $80 billion per quarter (Exhibit 3). If the industry incurs additional losses of $1 trillion in 2009 and 2010, the losses will be about $125 billion a quarter. As noted, however, these losses will be concentrated in commercial-banking loans. Importantly, many of these losses will be concentrated in the banks that the stress tests revealed to be undercapitalized.

Great writeup on why the second half of the credit crisis is still ahead of us. Read the full thing here:

What Next Us Banks


Read the rest of this entry >>

Tuesday, August 4, 2009

Shanghai stock index: How far to go?

It’s been a while since I posted anything using technical analysis. Back in early April, I had written about the 50 day 200 day Moving Average crossover in the Shanghai Stock market. I think we should look at the Shanghai index as a ‘leading indicator’ to gauge US markets. This crossover happened a good 2 months before the US markets did. We also got an early non-confirmation of the March lows when the Shanghai index failed to make a new low at that point of time. (Though of course volume and breadth were other valid non-confirmation signals as well).

Since I believe this is a cyclical rally in a secular bear, I wanted to use Fibonacci analysis to gauge the retracement levels in the Chinese markets. This basically gets you an idea of how far this bear market rally retracement should go. While you might not believe in Fibonacci or technical analysis, it's still useful to keep these levels in mind as selling and buying pressure would appear around these levels from people following these trends. As can be seen from the chart below, we’ve already crossed the 38% retracement level, which means the 50% retracement at 3800 on the Shanghai Index is in play. This suggests further upside ahead.


Since we’ve crossed the 38% retracement on the Shanghai index, I expect a similar move on the S&P 500 as well. A similar 50% retracement on the S&P 500 gets us to 1100, which suggests the stock rally should go through the 1000 level. (Note: I wrote this up on Sunday)


Babak points out the over-extended nature of the current rally, and the similarity to the speculative blow-off of October-November 2007. The RSI indicator in the chart is also similarly showing an overbought reading in excess of 70. This marked the top during the previous bull run. However, the overbought conditions became even more overbought, and stayed that way before the markets corrected. In fact, the Shanghai market went up more than 100% after registering RSI readings in excess of 70!!

Note also the similarity of the 1 day 7% decline last week to the February 26th, 2007 one day decline of 8.8%. (John Authers talks about this in FT.) The Shanghai markets continued rallying for the next few months after the decline in February 2007.

Add in the recent Dow Theory buy signal, and investor bullishness should persist. Ebulient animal spirits are back in vogue.

All this suggests that it’s not yet time to play the markets on the short side (except maybe for a multi-week short-term pull back).

Read the rest of this entry >>

Monday, August 3, 2009

Reading Links 08/02/2009

While the markets are overbought and due for a pullback, here are the reading links for this week:

  • Predicting how high the S&P500 can go (video)

  • The myth behind high GDP growth and Emerging markets : Over the long run, stocks in the world's hottest economies have performed half as well as those in the coldest.In stock markets, as elsewhere in life, value depends on both quality and price. When you buy into emerging markets, you get better economic growth -- but, at least for now, you don't get in at a better price.

  • Electronic trading and commodity prices : Electronic trading is the reason oil is showing such a high correlation to dollar and equities.

  • El-Erian: Rally Won't Last


  • Chart of the day: Dow Theory buy signal. This rally, while it will have its fits and starts, is the beginning of a new trend, not just a bounce. It is a significant opportunity.

  • Hussman : Biting A Bullet : Our defensive stance here is driven by a combination of poor price-volume sponsorship, moderate overvaluation, strenuous overbought conditions, Treasury yield and commodity price pressures, as well as a variety of other factors that have historically combined to produce a weak overall return-to-risk trade off.

    Taking the rally in stocks as an indicator of economic recovery (which the LEI largely does), and then taking the presumption of an economic recovery as a reason to buy stocks, all strikes me as circular reasoning.

    Frankly, projected 10-year returns here are at levels that typically characterized market tops, not bottoms, prior to about 1990. Stocks are emphatically not cheap here.

  • Secular bear, cyclical bull: The bottom line? Only one of the seven foundations of a secular bull market is in place. Three more are neutral, and the remaining three are bearish.
    Davis therefore concludes that we are more likely to be in a cyclical rather than secular bull market.

  • Goldman’s 23% Return Doesn’t Add Up.

  • Betting on Black Swans.


For more, please visit the news site, http://news.fundamentalinsights.slinkset.com/recent or click on the image below.


You can also follow me on Twitter @fundinsights where I comment and post links to interesting articles as and when I come across them.

Have a good week!

Read the rest of this entry >>