Showing posts with label markets. Show all posts

Monday, August 24, 2009

Emerging markets: “new era” bubble talk is back.

In the final phases of a bubble’s blowoff, the talk of new paradigms and global tectonic shifts comes into vogue. One hallmark of the emerging markets mania back in 2007 was the bubble talk that went with it(See my post here). China and India seemed like failsafe can’t miss destinations.


Well, looks like some of it is back. Look at this article for instance. Here’s an interesting chart from the same.


Let’s consider the data from 2003 to 2008 (A very short span of 5.5 years):

Share of World GDP:
Chinese GDP went from 4.4% of global GDP to 7.3 %, or a rise of 66%.
Indian GDP went from 1.5% of global GDP to 2 %, or a rise of 33%.

Share of World market capitalization:
Chinese market capitalization as a share of world market capitalization went from 1.1% to 7.1% , an increase of ~545%!!!
India's share went up from 0.9% to 2.8%, a rise of 211%

The stock markets in India and China have gone up almost 8-9 TIMES their rise in the share of world GDP! The author completely side stepped this issue, as well as  the issue of valuations.

A similar argument can be made on the "new era" talk of China surpassing Japanese stock market capitalization. This fails to take into account the deep-value nature of the Japanese market right now. (A lot of Japanese companies trade below book value).

While a lot of effort has gone into bearish prognostications about China in Q4 of 2009, a similar case can be made for India as well. A year back, I had written about the bear case on India. With the failed monsoons, sagging rural demand, hike in taxes, and a lack of  reforms, I am currently extremely bearish, and a bear case part 2 can certainly be made right now.

One might be tempted to argue that these markets are fairly valued since their share of global market capitalization is now similar to their share in global GDP, but the reality is that emerging markets come with their own set of idiosyncratic risks: lack of transparent accounting, insider manipulation, lack of real shareholder ownership, and government interference, to name a few. I would argue that their share of global stock market capitalization should be well below their share of global GDP. This is an extremely important and contentious argument that needs to be revisited. (Note that people like Jeremy Grantham actually disagree on this one).

For now, suffice to say, bubble talk is back.

Read the rest of this entry >>

Monday, August 10, 2009

Reading links 8/9/2009

With markets going higher week after week, looks like we’re back in Wonderland.. Even Roubini is bullish!

Here are the reading links for this week:

  • The sick fight over health care: (Great read) A too-cautious Obama has let the right define the debate -- and now meaningful reform hangs in the balance. (Salon)

  • Earnings: Worst Decline In History: While this is certainly makes for a great story that we can tell and retell to the grand kids (boring them to tears), it doesn’t really mean much. We are at an extraordinary moment in economic history. One where we are clinging to the ledge by our fingernails and peering down at the precipice below. In such unorthodox times, orthodox measures such as the price earnings ratio can fool, rather than inform you. (Trader's Narrative)

  • Melting up in the Summer heat : While a lot of attention is being focused on the S&P 500's move above 1,000, most chartists are probably focused on 1,005. As shown below, the S&P 500 failed twice to rally above this level back in October and November of last year. If the index manages to meaningfully break above 1,005, there is little in the way of resistance for the next 95 S&P 500 points. (Bespoke)

  • How to Fix the Health-Care ‘Wedge’ (WSJ)

  • The Running of the Sheep: Today we get word that equity fund inflows this week have been HUGE - the largest since August 2007, shortly after which the market peaked, followed by a sickening plunge. Now that the market has run up some 46% since the last Running (away) of the Sheep, the woolly stampede as reversed direction. Will the carnage be just as bad this time? History says yes... (InvestorWalk)

  • Tudor Investment Corp says it’s a bear market rally: Tudor essentially sees the market rallying then falling, and then repeating the cycle again. We are currently in the midst of a large rally which he feels will subside and give way to a decline in markets come September of this year. Tudor cites numerous negative catalysts for the move, including slowed growth in China. However, he still thinks that the markets will end the year then on a positive note and would be a buyer on large dips purely for the trade. This is because he thinks that 2010 could be another negative year for stocks as the rallying then declining cycle plays on. Being nimble is the name of the game and letting the tape lead you is the key here. (MarketFolly)

  • Credit Suisse - Market Now At Euphoric Levels. (Zero Hedge)

  • Mark Hulbert : Four indicators to watch for when rally may be over: The bottom line? Only one of these four indicators is even close to flashing a warning signal right now, which is why Davis is bullish right now. (Marketwatch)

  • The Elusive Correction Is Upon Us: As the bears continue to wonder when stocks will swoon again, investor sentiment data is starting to line up in their favor. (Barron's)

  • CHART OF THE DAY: Shades Of 1929 (Clusterstock)

  • Do Index Funds Contribute to Mispricing? (Dimensional Funds)

  • Banks Prepping to Bring More Assets Back Home to Balance Sheets. (WSJ)

  • Have We Reached a Top? (Minyanville)

  • What does a double dip recession look like? (Credit Writedowns)

  • Too many crooks.(PDF): Why Europe is attractive,and the problem with I-banks. (Price of Everything)

  • Brace for a decade of lower Chinese growth : Over the next five years or more Chinese economic growth is going to be constrained by growth in Chinese consumption. The massive but unsustainable investment in infrastructure and new production facilities that characterises the Chinese fiscal stimulus package will not be able to change this fact. From its dizzying heights during the past two decades, the world needs to prepare itself for a decade during which, if all goes well, China grows at a still respectable but much lower rate of 5-7 per cent. If the current fiscal stimulus package retards China’s adjustment process, as many analysts argue that it does, growth rates may be much lower. (FT)

  • The (confused) economics of cash for clunkers (Curious Capitalist)

  • Stock Market History Of High Momentum Thrusts : Bullish in the longer and intermediate term. (Trader's Narrative)

For more, please visit the news site,http://news.fundamentalinsights.slinkset.com/ .You can also visit @fundinsights on Twitter for real time updates.

Read the rest of this entry >>

Tuesday, August 4, 2009

Shanghai stock index: How far to go?

It’s been a while since I posted anything using technical analysis. Back in early April, I had written about the 50 day 200 day Moving Average crossover in the Shanghai Stock market. I think we should look at the Shanghai index as a ‘leading indicator’ to gauge US markets. This crossover happened a good 2 months before the US markets did. We also got an early non-confirmation of the March lows when the Shanghai index failed to make a new low at that point of time. (Though of course volume and breadth were other valid non-confirmation signals as well).

Since I believe this is a cyclical rally in a secular bear, I wanted to use Fibonacci analysis to gauge the retracement levels in the Chinese markets. This basically gets you an idea of how far this bear market rally retracement should go. While you might not believe in Fibonacci or technical analysis, it's still useful to keep these levels in mind as selling and buying pressure would appear around these levels from people following these trends. As can be seen from the chart below, we’ve already crossed the 38% retracement level, which means the 50% retracement at 3800 on the Shanghai Index is in play. This suggests further upside ahead.


Since we’ve crossed the 38% retracement on the Shanghai index, I expect a similar move on the S&P 500 as well. A similar 50% retracement on the S&P 500 gets us to 1100, which suggests the stock rally should go through the 1000 level. (Note: I wrote this up on Sunday)


Babak points out the over-extended nature of the current rally, and the similarity to the speculative blow-off of October-November 2007. The RSI indicator in the chart is also similarly showing an overbought reading in excess of 70. This marked the top during the previous bull run. However, the overbought conditions became even more overbought, and stayed that way before the markets corrected. In fact, the Shanghai market went up more than 100% after registering RSI readings in excess of 70!!

Note also the similarity of the 1 day 7% decline last week to the February 26th, 2007 one day decline of 8.8%. (John Authers talks about this in FT.) The Shanghai markets continued rallying for the next few months after the decline in February 2007.

Add in the recent Dow Theory buy signal, and investor bullishness should persist. Ebulient animal spirits are back in vogue.

All this suggests that it’s not yet time to play the markets on the short side (except maybe for a multi-week short-term pull back).

Read the rest of this entry >>

Monday, August 3, 2009

Reading Links 08/02/2009

While the markets are overbought and due for a pullback, here are the reading links for this week:

  • Predicting how high the S&P500 can go (video)

  • The myth behind high GDP growth and Emerging markets : Over the long run, stocks in the world's hottest economies have performed half as well as those in the coldest.In stock markets, as elsewhere in life, value depends on both quality and price. When you buy into emerging markets, you get better economic growth -- but, at least for now, you don't get in at a better price.

  • Electronic trading and commodity prices : Electronic trading is the reason oil is showing such a high correlation to dollar and equities.

  • El-Erian: Rally Won't Last


  • Chart of the day: Dow Theory buy signal. This rally, while it will have its fits and starts, is the beginning of a new trend, not just a bounce. It is a significant opportunity.

  • Hussman : Biting A Bullet : Our defensive stance here is driven by a combination of poor price-volume sponsorship, moderate overvaluation, strenuous overbought conditions, Treasury yield and commodity price pressures, as well as a variety of other factors that have historically combined to produce a weak overall return-to-risk trade off.

    Taking the rally in stocks as an indicator of economic recovery (which the LEI largely does), and then taking the presumption of an economic recovery as a reason to buy stocks, all strikes me as circular reasoning.

    Frankly, projected 10-year returns here are at levels that typically characterized market tops, not bottoms, prior to about 1990. Stocks are emphatically not cheap here.

  • Secular bear, cyclical bull: The bottom line? Only one of the seven foundations of a secular bull market is in place. Three more are neutral, and the remaining three are bearish.
    Davis therefore concludes that we are more likely to be in a cyclical rather than secular bull market.

  • Goldman’s 23% Return Doesn’t Add Up.

  • Betting on Black Swans.


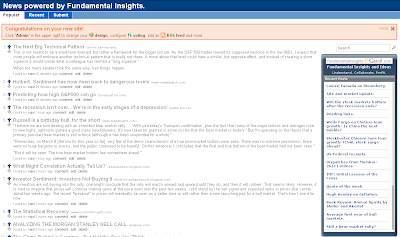
For more, please visit the news site, http://news.fundamentalinsights.slinkset.com/recent or click on the image below.


You can also follow me on Twitter @fundinsights where I comment and post links to interesting articles as and when I come across them.

Have a good week!

Read the rest of this entry >>

Friday, July 31, 2009

Emerging markets: the starting valuation issue.


Purple haze all in my brain

Lately things just dont seem the same

Actin funny, but I dont know why

scuse me while I kiss the sky


Jimi Hendrix and Purple Haze might conjure up images of pot smoking beach bums, but it’s emerging markets investors whom I’m thinking of right now (especially India and China). Unless you’ve been living under some rock, you are probably aware that there has been some concern that the emerging markets might be suffering from some speculative froth. BRIC 2050 indeed! I've written about emerging markets valuations before here and here. Interestingly, similar arguments would hold true even today.

Exhibit 1: This excellent presentation on investing in emerging markets which had this interesting slide:


While they make some excellent points on emerging markets, historical returns, diversification and high GDP growth rates, I thought they missed out on one HUGE one. In any market, in any situation, the starting valuation is the most important determinant of your subsequent (ex-ante) returns. (Here are three excellent pieces by Hussman on how valuation is a solid predictor of ex-ante returns in the US markets. )

The data presented in the slide is obviously about a month or two old. Book value for India’s BSE Sensex 30 is currently 3.7 with a dividend yield of 1.2%. Price-earnings ratio for China is 35-40. Buying an index, any index, at 4 times book value or 30-40 times earnings is a recipe for disaster.

Note to Jeremy Grantham: No need to worry about blowing an emerging markets bubble. We’ve already gone ahead and done that. What’s even more astonishing is that this bubble has formed in the middle of the Great Recession. (Interestingly, GMO’s emerging markets fund is underweight India and China).


Valuations. Valuations. Valuations. That’s what investing is all about. It’s not about market timing, but market and stock pricing. Stock markets sell at 40 times earnings or 4 times book towards the END of bull markets. I realize some bubbles have ended in 60-70 P/E multiples, but irrational parabolic blow offs are very hard to time at the top – the markets could go up another 50%, but it’ll still qualify as a bubble. Bubbles tend to last longer than you can stay solvent.

Stocks in India and China are priced to deliver disappointing returns. Even if these countries grow like rock stars, much of that is already priced in. Investors banking on emerging markets for their mojo might get neutered in the process.

Read the rest of this entry >>

Monday, July 27, 2009

GMO's Jeremy Grantham July Newsletter

Jeremy Grantham just came out with his latest investment newsletter. These 2 charts best quantify the speculative nature of the latest rally:


Read the full thing here:

Grantham GMO July 2009


Read the rest of this entry >>

Reading links

Another week. Another set of great reading news links. Here’s a sneak preview:

  • Why Diversification Results In Mediocrity

  • 7 Reasons Why Housing Isn’t Bottoming Yet

  • Earnings back to 1922 (Chart).

  • PIMCO says buy US Treasuries!!

  • A sanity check for bulls: What is your forecast for the following a year from now?

    Tax rate, including state, local, property and sales taxes (Up, down or flat)
    Short term interest rates (Up, down or flat)
    Employment (Up, down or flat)
    Savings rate, remember the new frugality (Up, down or flat)
    Consumer confidence (Up, down or flat)
    Do your answers add up to a bullish outlook for the economy? I didn’t think so.

  • Dow Theory calls a bull market: The long-awaited Dow Theory bull market signal finally arrived yesterday. This came about as a result of the Dow Jones Industrial Average and the Dow Jones Transportation Average both breaking through their previous rally peaks (registered on 12 and 11 June respectively).

  • Predicting how high S&P500 can go (Video)

  • The recession isn't over... We're in the early stages of a depression! (Video)

  • The Next Big Technical Pattern : This is not meant to be a short-term forecast but rather a framework for the bigger picture. As the S&P 500 trades toward its supposed neckline in the low 960s, I expect that more people will embrace another technical pattern that is really not there. A move above that level could have a similar, but opposite effect, and instead of creating a short squeeze it would create what a colleague has termed a "long squeeze."
    When too many people think the same way, bad things happen.

  • Investor Sentiment: Investors Not Buying It : As investors are not buying into the rally, one might conclude that the rally will march onward and upward until they do, and then it will rollover. That seems likely. However, it is hard to imagine that prices will continue making gains at the pace seen over the past two weeks. I still stand by the sell signal and expected spike in prices that I wrote about two weeks ago. The recent "breakout" in prices will eventually be seen as a better time to sell rather then a new launching pad for a bull market. That's how I see it for now.


For much much more, please visit http://news.fundamentalinsights.slinkset.com/ or click the image below.

Fundamental Insights News

Read the rest of this entry >>